
Introduction
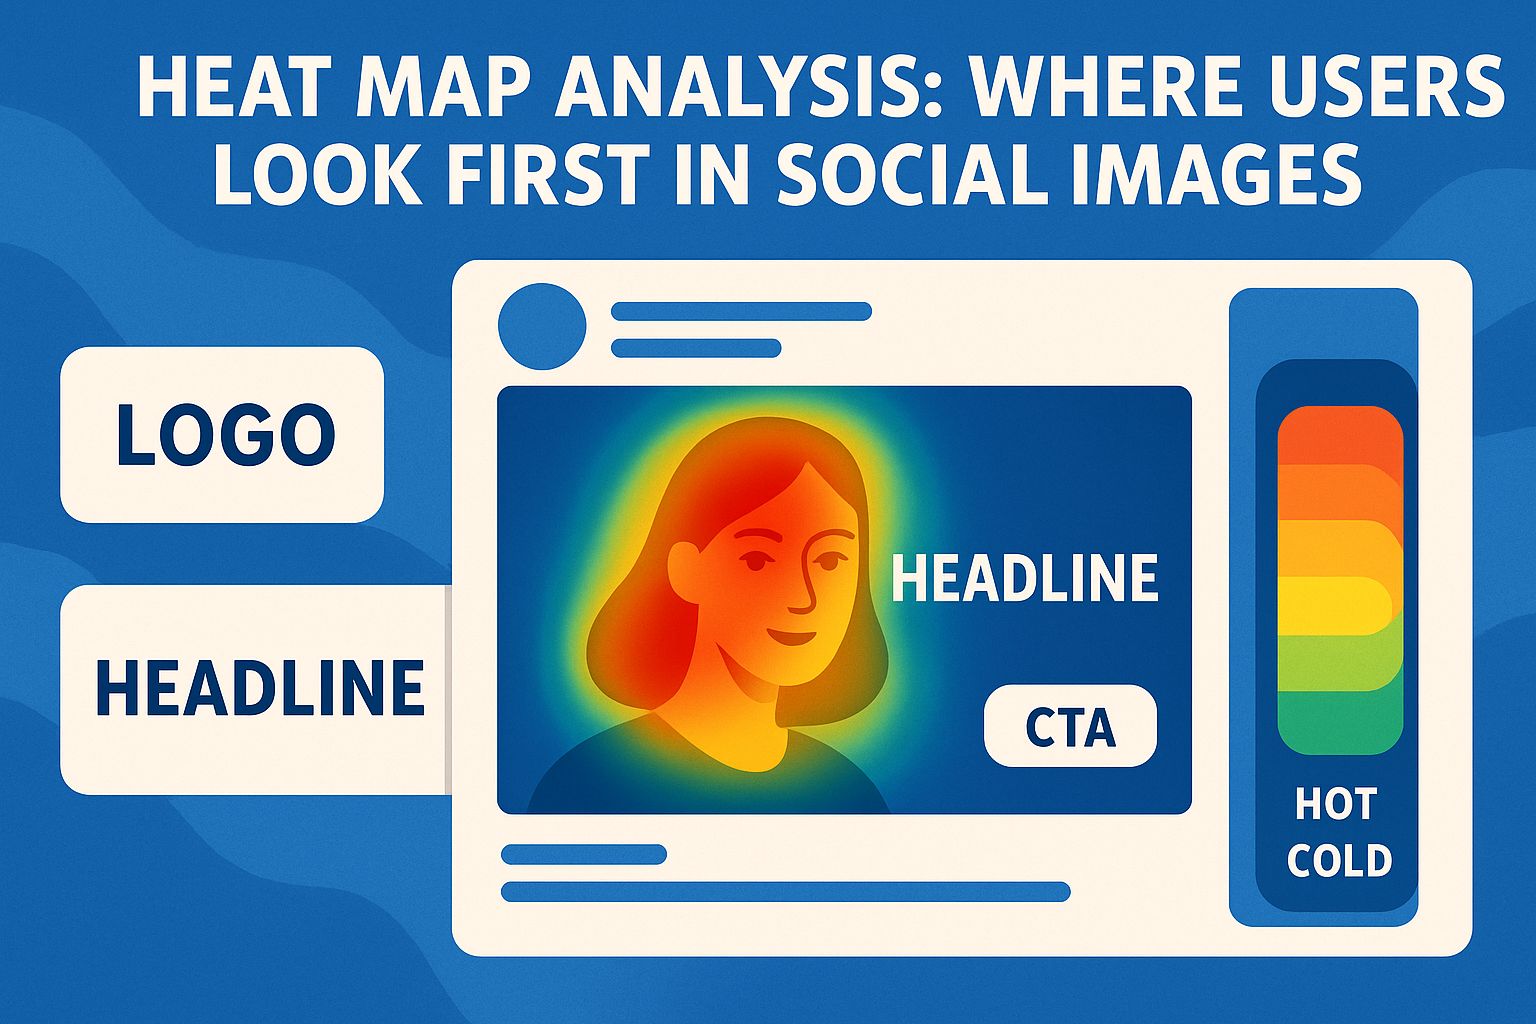
Heat maps reveal where attention clusters in the first seconds of exposure so designers can place faces, headlines, logos, and CTAs where users actually look in social feeds. Modern eye-tracking and AI attention models turn those hot and cold zones into quick, actionable guidance before a campaign goes live.
What heat maps show (and why)
- Heat maps aggregate fixations to visualize hot spots (high attention) and cold areas (low attention), helping prioritize focal elements like faces or hooks in the visual hierarchy.
- Gaze plots complement heat maps by showing scan order, clarifying whether eyes reach brand marks and CTAs early—or miss them entirely.
- AI attention heatmaps predict likely hot zones without lab panels, accelerating pre-launch checks across many variants and placements.
Where users look first in social images
- Faces dominate early attention: viewers fixate on the eyes-nose-mouth "T-zone," so expressive faces with clean backgrounds anchor gaze quickly.
- In the absence of a dominant subject, attention centralizes in the middle of the frame due to central bias, making the central band a strong candidate for hooks and CTAs.
- Text-heavy contexts trigger scanning patterns (e.g., F-pattern), where attention starts near the top and then sweeps left-to-right before moving down, so top-area hooks and left-aligned highlights perform well in feed cards and thumbnails.
Scanning patterns and social UIs
- The F-pattern concentrates fixations at the top and along the left of content blocks, which supports putting the most important message near the top and aligning short, bold headers to the primary reading path.
- Z-pattern flows are effective in visual-first layouts (hero image → supporting visual → CTA), guiding gaze diagonally across minimal text compositions common in ads and cover images.
- When UI overlays intrude (captions, buttons, progress bars), central placements and safe-zone padding help the main message survive platform chrome and responsive crops.
Faces, gaze direction, and attention cues
- Faces outperform objects for initial fixations; attention clusters on facial features, so cropping faces large and clear helps hooks land in fast-scroll contexts.
- Gaze direction can redirect attention: subjects looking toward a headline or product can nudge viewer eyes along that path, improving the chance key elements get seen.
- When faces are absent, strong edges, high local contrast, and simple shapes help define an unambiguous focal point early in the scan.
Logos, headlines, and CTAs: placement by heat map
- Headlines: Place in the central or upper band where heat maps often show early fixations, and use high luminance contrast so text remains legible on mobile.
- CTAs: Position within the central third or along the Z-flow end-point for visual-led compositions, verifying with predicted or recorded gaze order that the CTA is visited within the first seconds.
- Logos: Keep compact and away from busy edges; verify that fixations reach the logo after headline/hero to avoid competing for first attention while still encoding brand recall.
Export attention-ready images with central-band layouts
Create platform-ready images with proven central-band hooks and safe-zone templates using SocialPixOptimizer's platform presets.
Get Started FreeAI attention heatmaps vs live eye tracking
- Predictive heatmaps simulate human gaze from learned saliency, enabling instant checks across many versions before spending on panels or media.
- Live eye-tracking validates edge cases (e.g., crowded scenes, cultural nuances), and produces scan paths that confirm sequence to logo and CTA, not only hot spots.
- A pragmatic approach: iterate with AI predictions to shortlist winners, then validate a small set with participants or platform-level A/B tests.
How to run a quick social image heat-map review
- Upload the image (or set) to a predictive attention tool and review hot zones; confirm the face/hero, headline, and CTA appear inside warm areas.
- Check gaze sequence: ensure the hook is seen first, then the product or key visual, then brand mark/CTA in a short path (e.g., 1-2-3 fixation order).
- Iterate focal point, contrast, and layout; re-run until the warm zones align with the intended story arc across target aspect ratios.
Applying heat-map insights to common formats
- Thumbnails and covers: Make 2–3 word hooks large in the central band; faces or clear icons should sit near the first fixation zone in predicted maps.
- Carousels: Put the primary hook on slide 1 where early fixations cluster; use consistent headline placement so the gaze path repeats across swipes.
- Stories/Reels (9:16): Keep hooks and key visuals centered; avoid top/bottom where overlays pull attention away or obscure content.
Interpreting results (do's and don'ts)
- Do: Read both hot spot location and scan order; a warm logo without early path access can still underperform if the hook is weak.
- Do: Compare multiple variants with identical copy; isolate one layout or contrast change at a time for clean learning.
- Don't: Assume one pattern fits all; text-heavy vs image-heavy assets trigger different scanning behaviors (F vs Z), so test per content type.
Team workflow and documentation
- Capture each image's heat map, gaze sequence, and quick notes (hook, product, brand path) in a shared board for future templates.
- Standardize central band hooks, minimum text sizes, and safe-zone padding as reusable rules encoded in templates across platforms.
- Re-validate top templates quarterly with predictive tools or small eye-tracking panels, especially when platform UI shifts.
Common mistakes to avoid
- Placing hooks or faces near obscured UI zones (bottom bars, caption overlays) where early fixations won't reach them.
- Over-stuffing text or low-contrast headlines that generate scattered, weak hot spots instead of a strong focal entry.
- Relying on one creative across formats without rechecking heat maps for each aspect ratio and platform chrome.
Conclusion
Heat-map analysis answers the decisive question for social visuals: do eyes land on the hook first, travel through the story, and reach the brand or CTA in seconds? By combining predictive attention heatmaps with selective validation, teams can center faces, strengthen contrast, and position headlines and CTAs in proven hot zones—turning fast scans into clicks, saves, and brand recognition across formats.